Gaia Angelini, Zoltan Kun, Attila Jambor
TRADE4SD has just published a deliverable (D1.3) and an associated dashboard to visualise the relationship between global agri-food trade and sustainability. The tool aims to visualise in what ways agri-food trade is directly and indirectly as well as positively and negatively related to the different SDGs.
Based on word counts and appearance frequencies, three dimensions of sustainability are identified with nine topics representing the most important avenues through which agri-food trade and the SDGs are interrelated: (1) markets and value chains, (2) economic development and growth, (3) policies and governance, (4) food and nutrition security, (5) labour and employment, (6) livelihoods and wellbeing, (7) biodiversity, (8) GHG emission, pollution and deforestation and (9) renewable energy.
The visualisation dashboard has five different levels and the deeper one goes, the more complex nature of the relationships becomes available. Level 1 shows the three dimensions of sustainability, while Level 2 introduces each dimension. Level 3 provides and introduction to the nine sub-dimensions analysed (organised around the three main dimensions), followed by Level 4 demonstrating the linkages between sub-dimensions and SDGs. The proportion of positive (green) and negative (red) linkages between a particular SDG and the sub-dimension appears below the SDG (the proportion is based on the number of studies found in D1.1). Level 5 shows the articles that reported positive (green letters) or negative (red letters) linkages between the sub-dimension and the particular SDG (a hyperlink is inserted into the name of author(s) which takes the reader to the full study on its original URL).
We recommend the dashboard to all colleagues interested in better understanding the linkages between agri-food trade and SDGs from a scientific point of view. The dashboard clearly shows how many scientific articles have been already dealing with the relationships and to what extent these are direct/indirect and positive/negative. The background paper on the framework behind can be found here.
Level 1 – opening page: it shows the 3 dimensions of sustainability which were analysed in Task 1.1 / D1.1 (Figure 1).
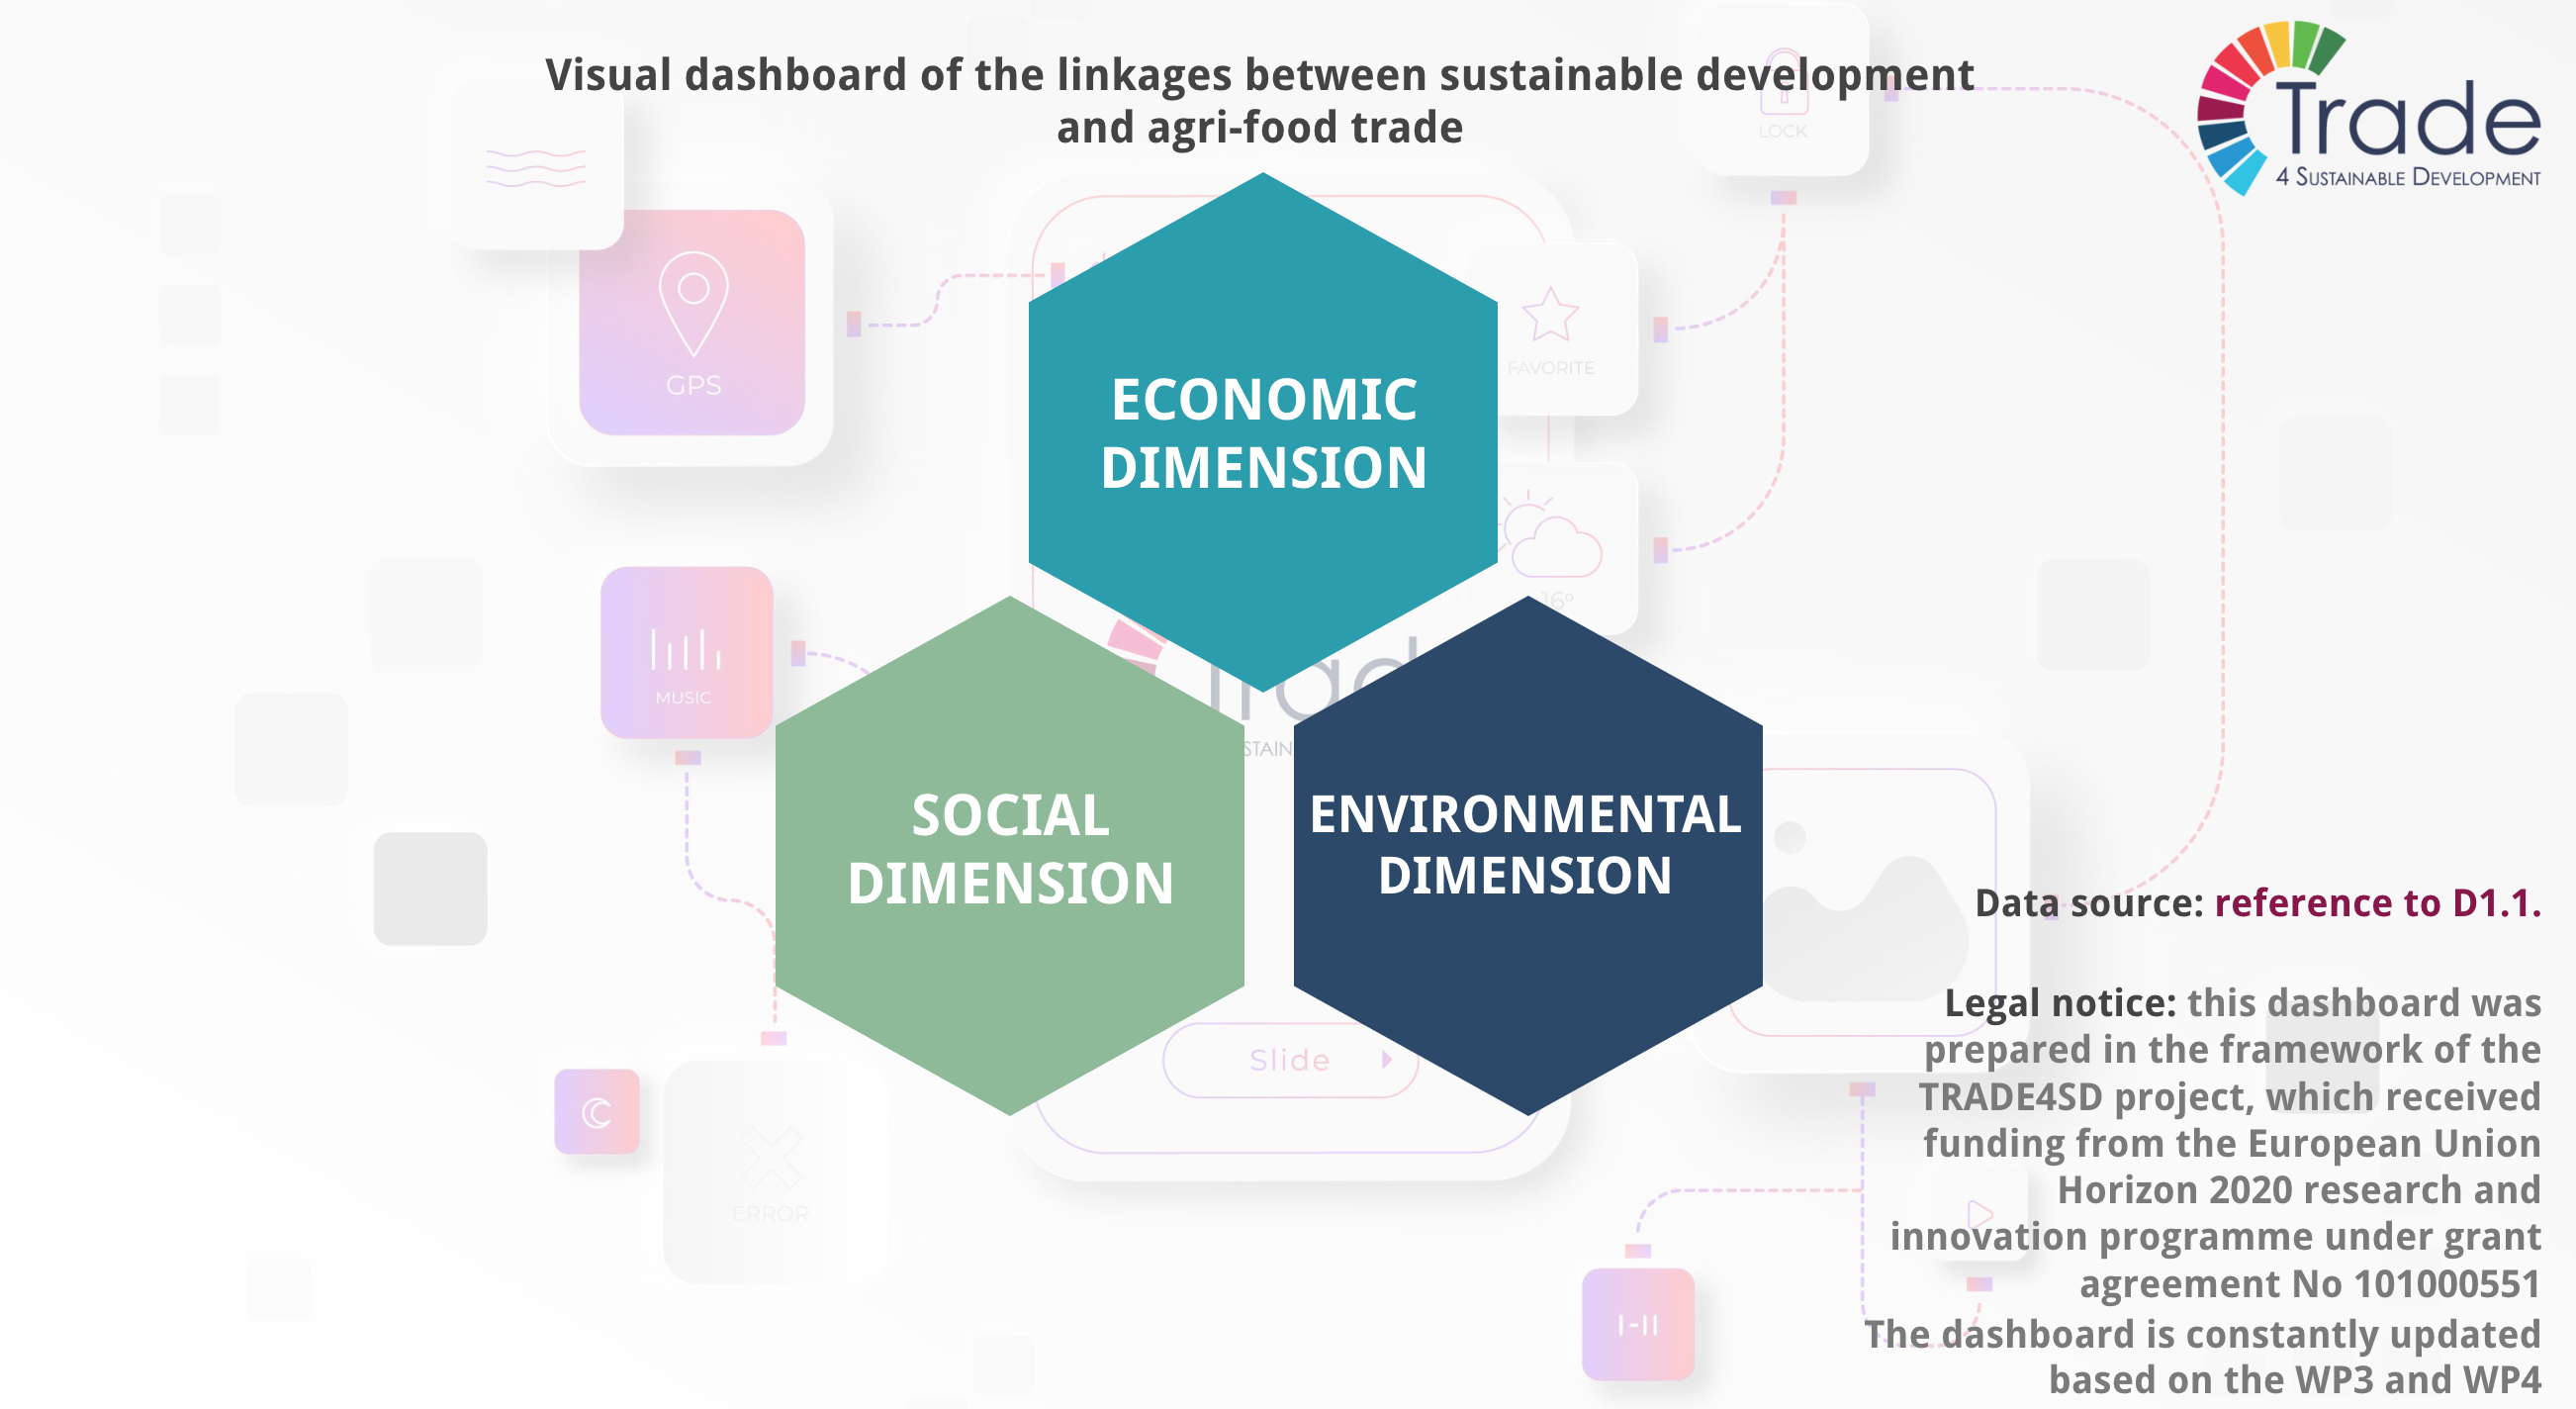
Figure 1: Opening page of the dashboard
Level 2 – introduction to the 3 dimensions: when clicking on the hexagon of a dimension a small “talking box” appears which explains the dimension (Figure 2-4).
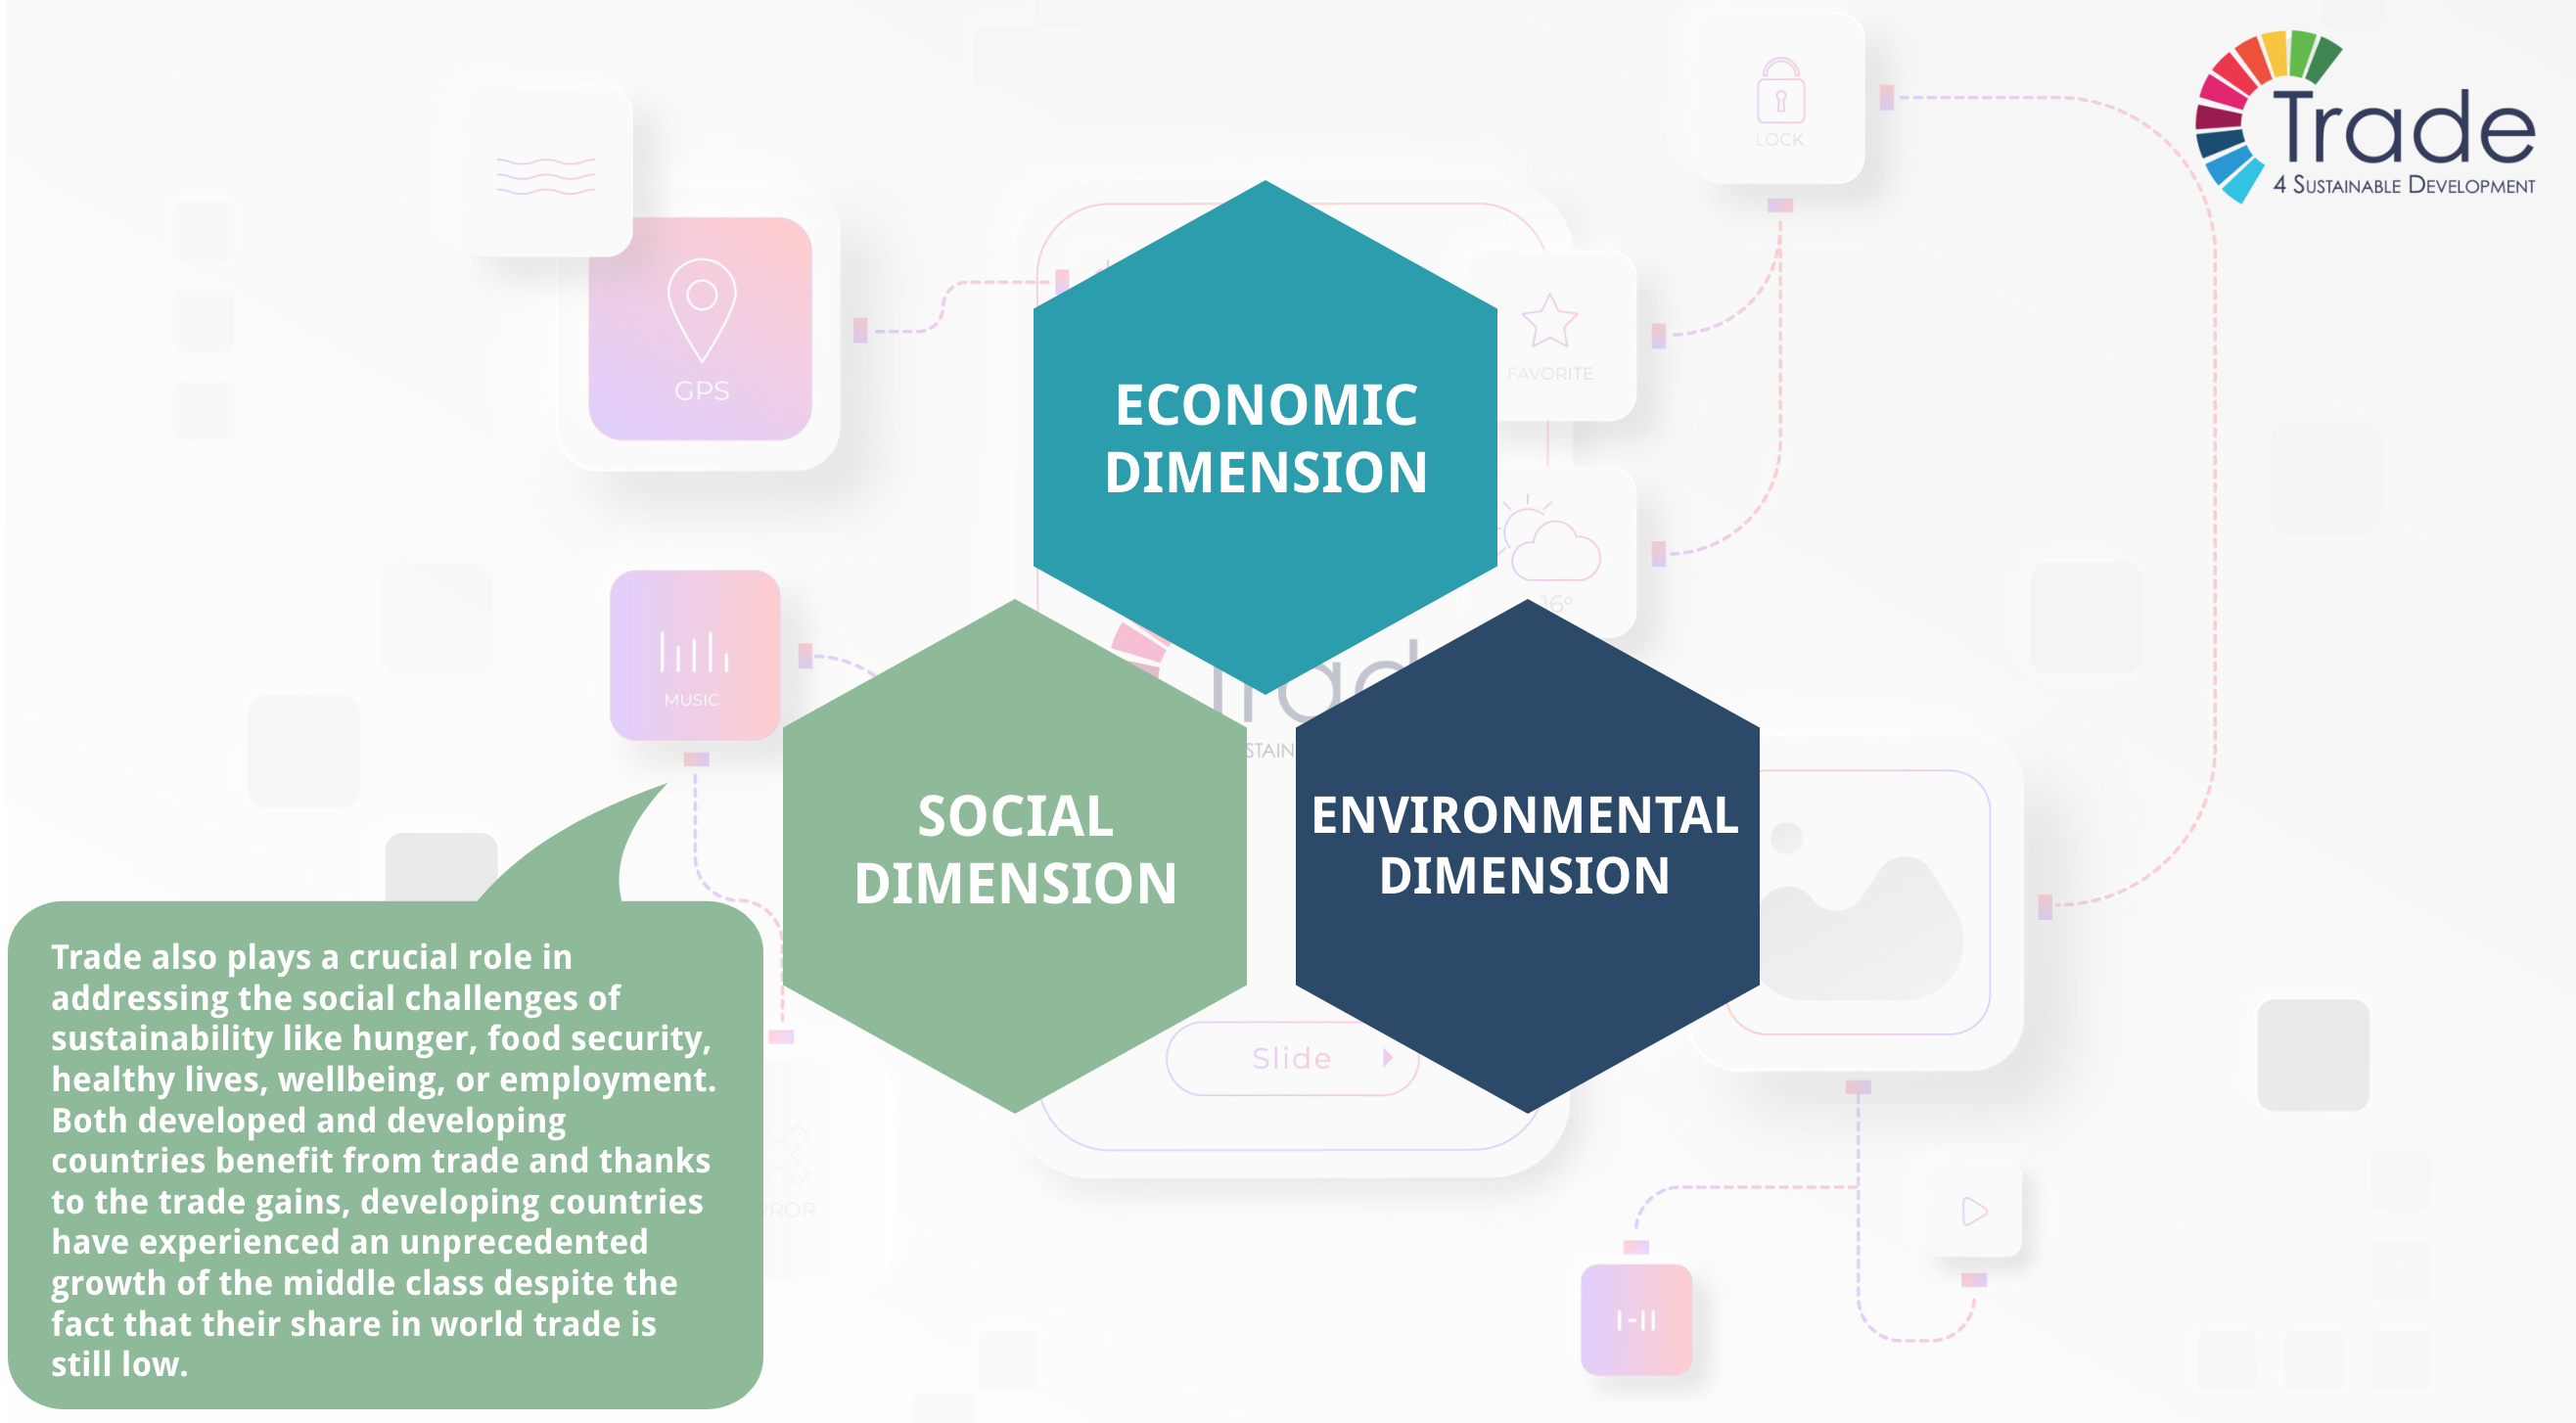
Figure 2: Introduction to Social dimension
Level 3 – introduction to the 3 sub-dimensions: the second click on the hexagon of a dimension will open the 3rd level of the dashboard which shows the 3 sub-dimensions analysed in the framework of Task 1.1. Each sub-dimension has a small explanatory box. The right-hand lower corner of the page includes an arrow which takes the reader back to the previous page (Figure 5).
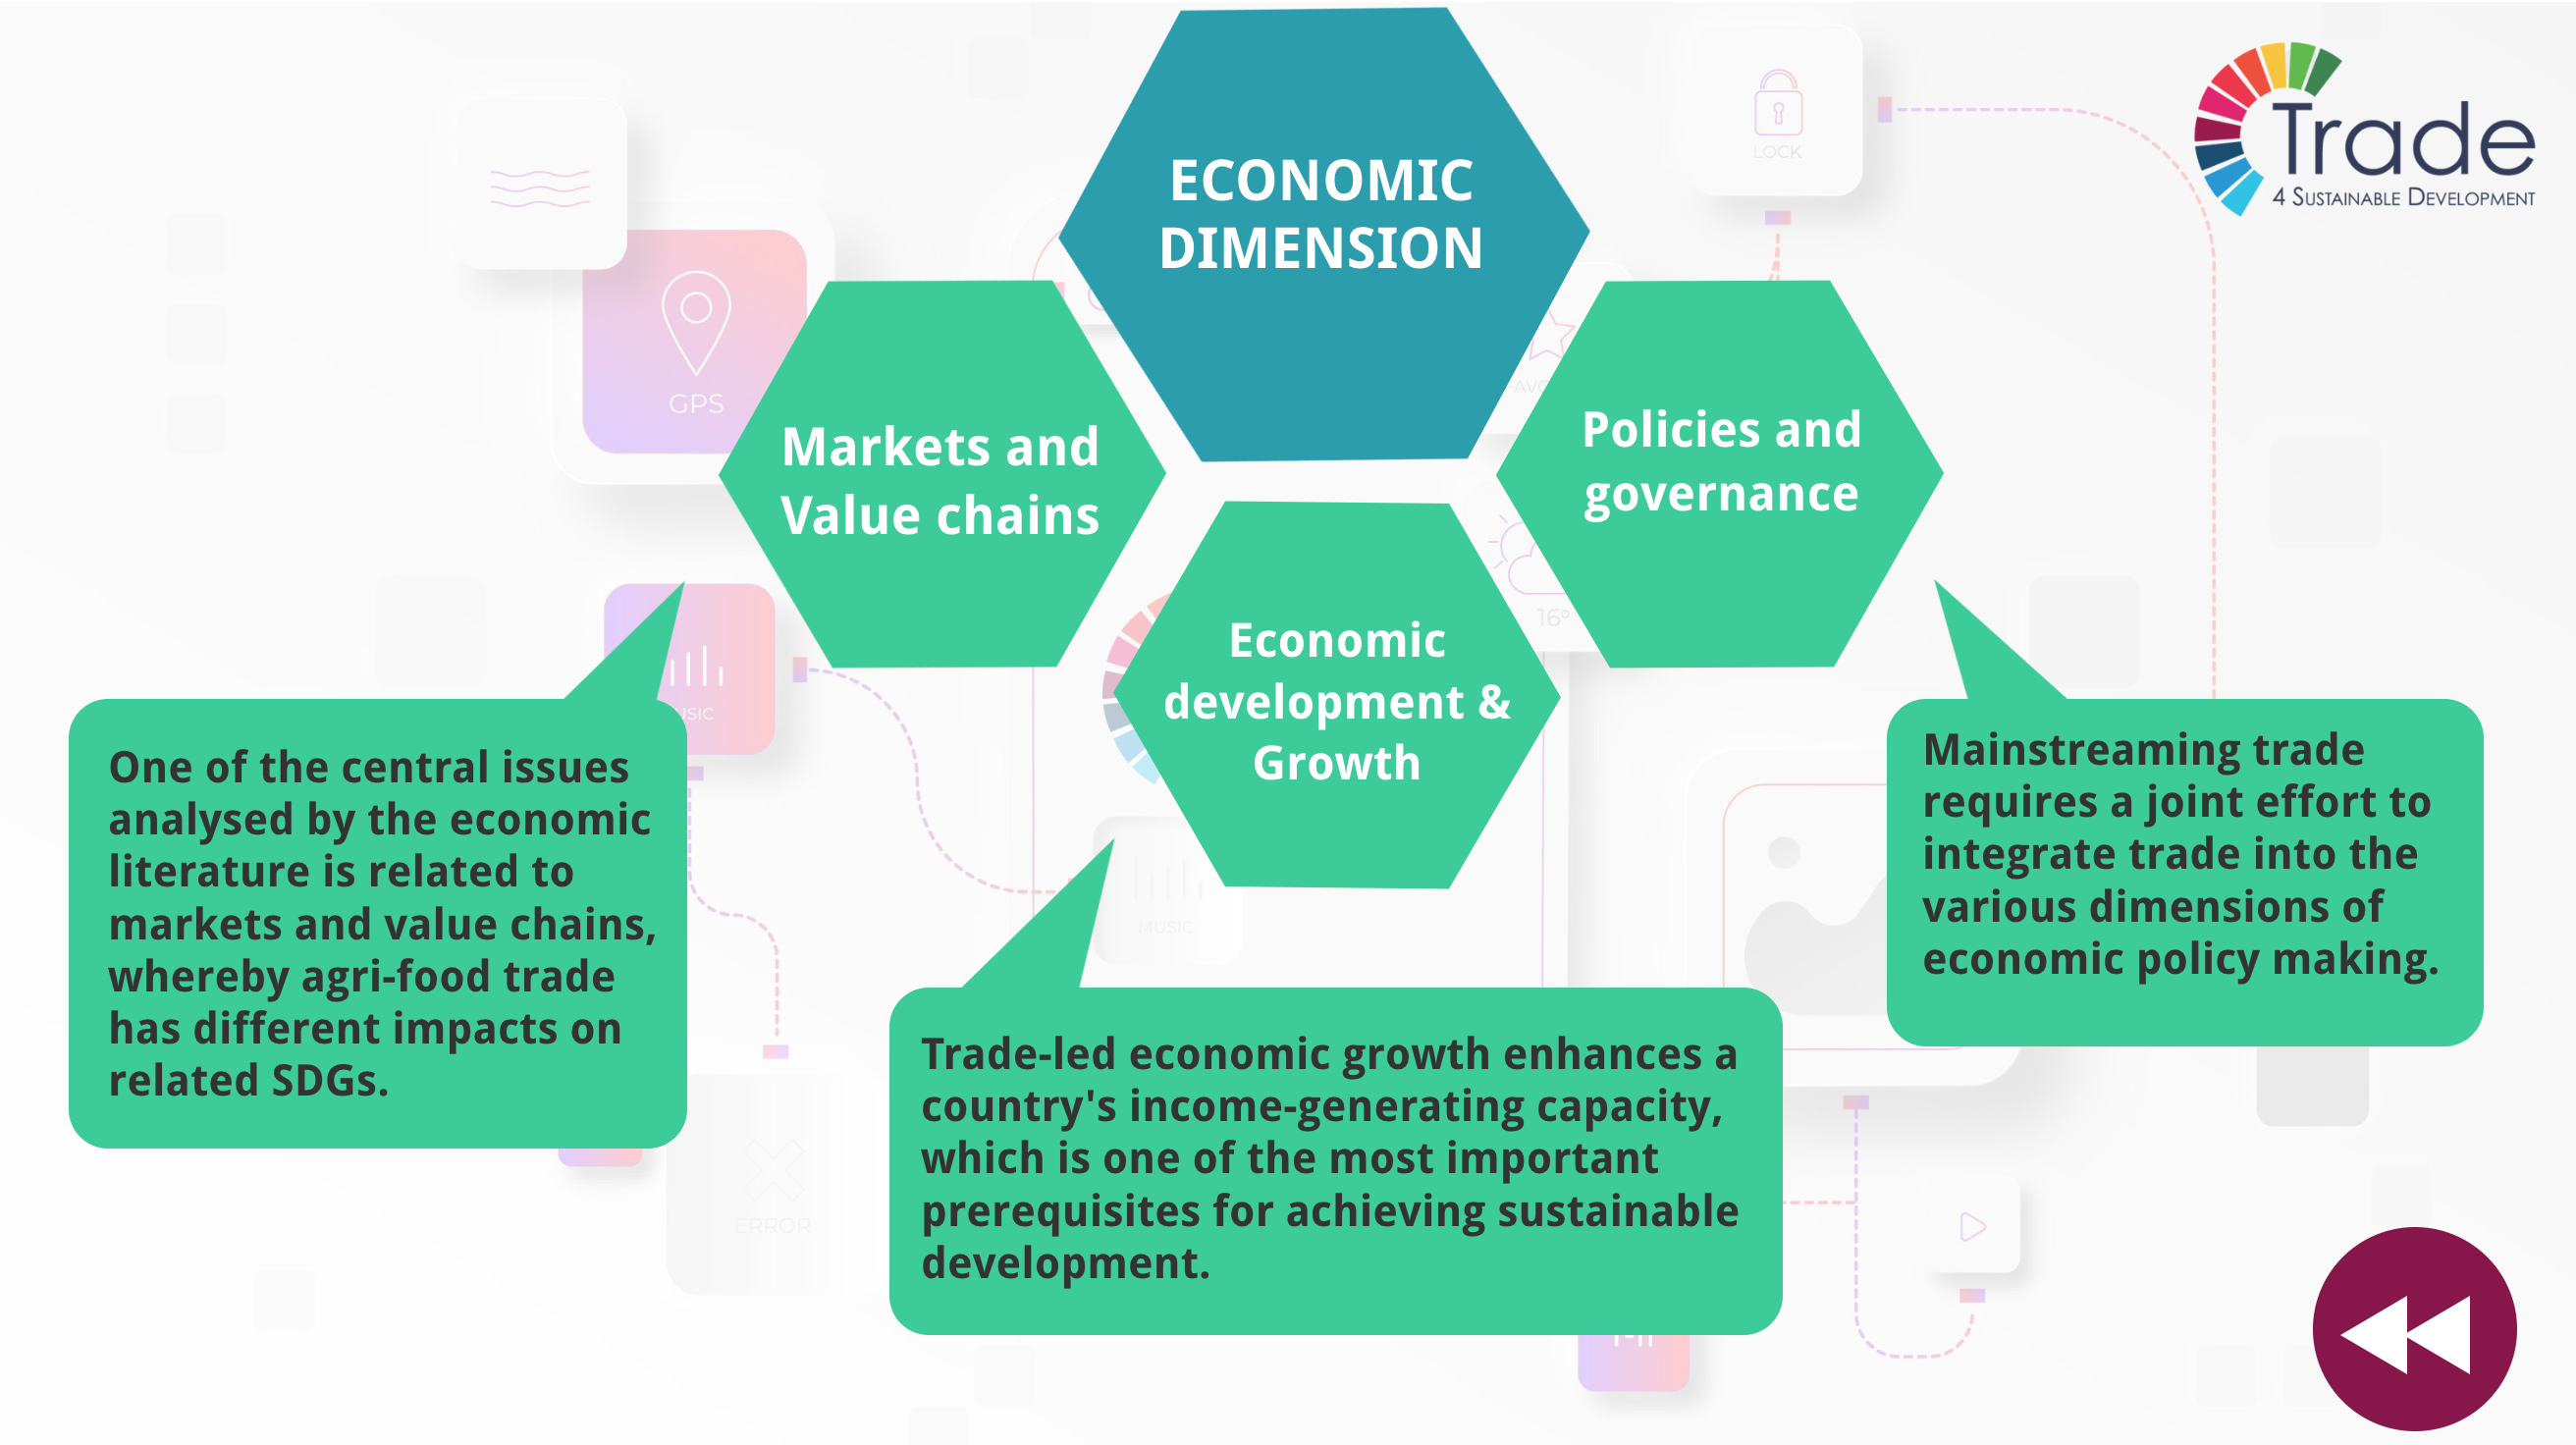
Figure 3: Example of Level 3 introducing the sub-dimensions of the Economic sustainability
Level 4 – introduction to the linkages between sub-dimensions and SDGs: by clicking on the hexagon of a sub-dimension the reader arrives on level 4 which shows which SDGs are linked to the selected sub-dimension (Figure 6).
The proportion of positive (green) and negative (red) linkages between a particular SDG and the sub-dimension appears below the SDG. The proportion is based on the number of studies found in the framework of Task 1.1.
The arrow in the right-hand lower corner takes the reader back to the previous page.
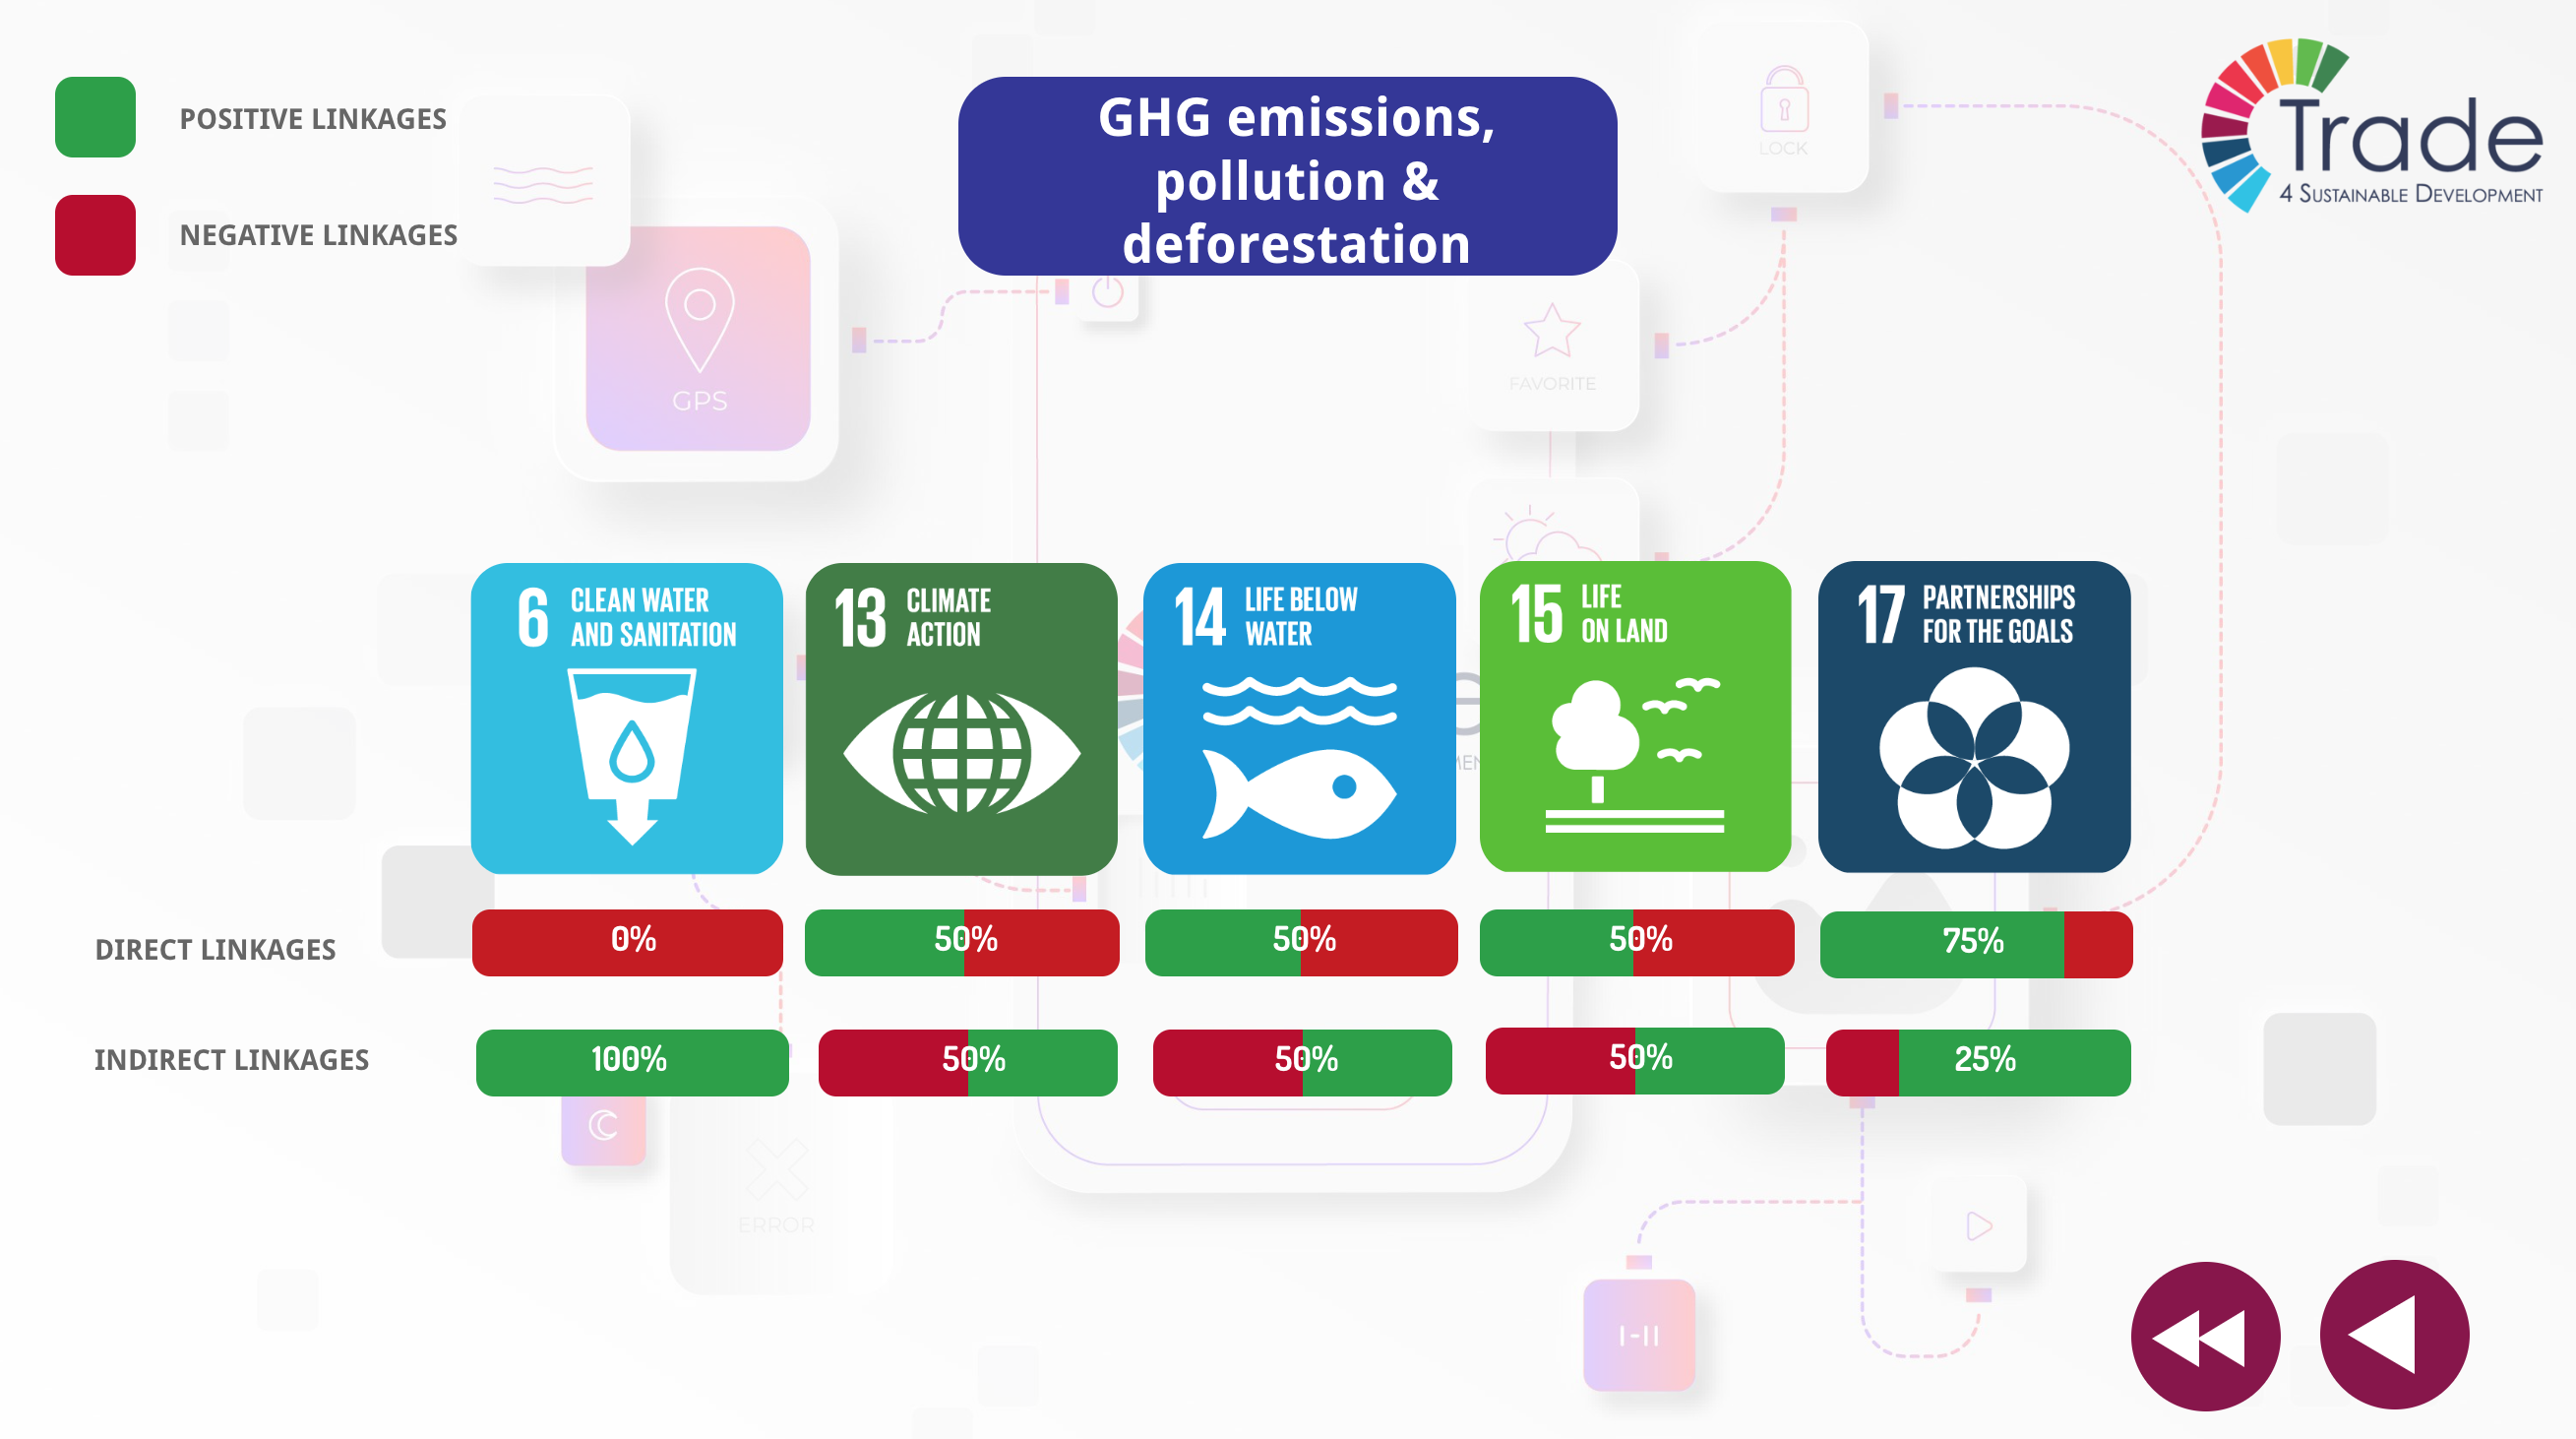
Figure 4: Example of Level 4 introducing the linkages to a sub-dimension (Markets & Value chains)
Level 5 – showing the studies that reported positive (green letters) or negative (red letters) linkage between the sub-dimension and the particular SDG: by clicking on the box of an SDG the reader arrives on level 5, which lists the analysed studies. In order to better inform the reader, a hyperlink is inserted into the name of author(s) which takes the reader to the full study on its original URL (Figure 7).
By clicking on symbol X in the right-hand upper corner, the reader closes the box and goes back to level 4.
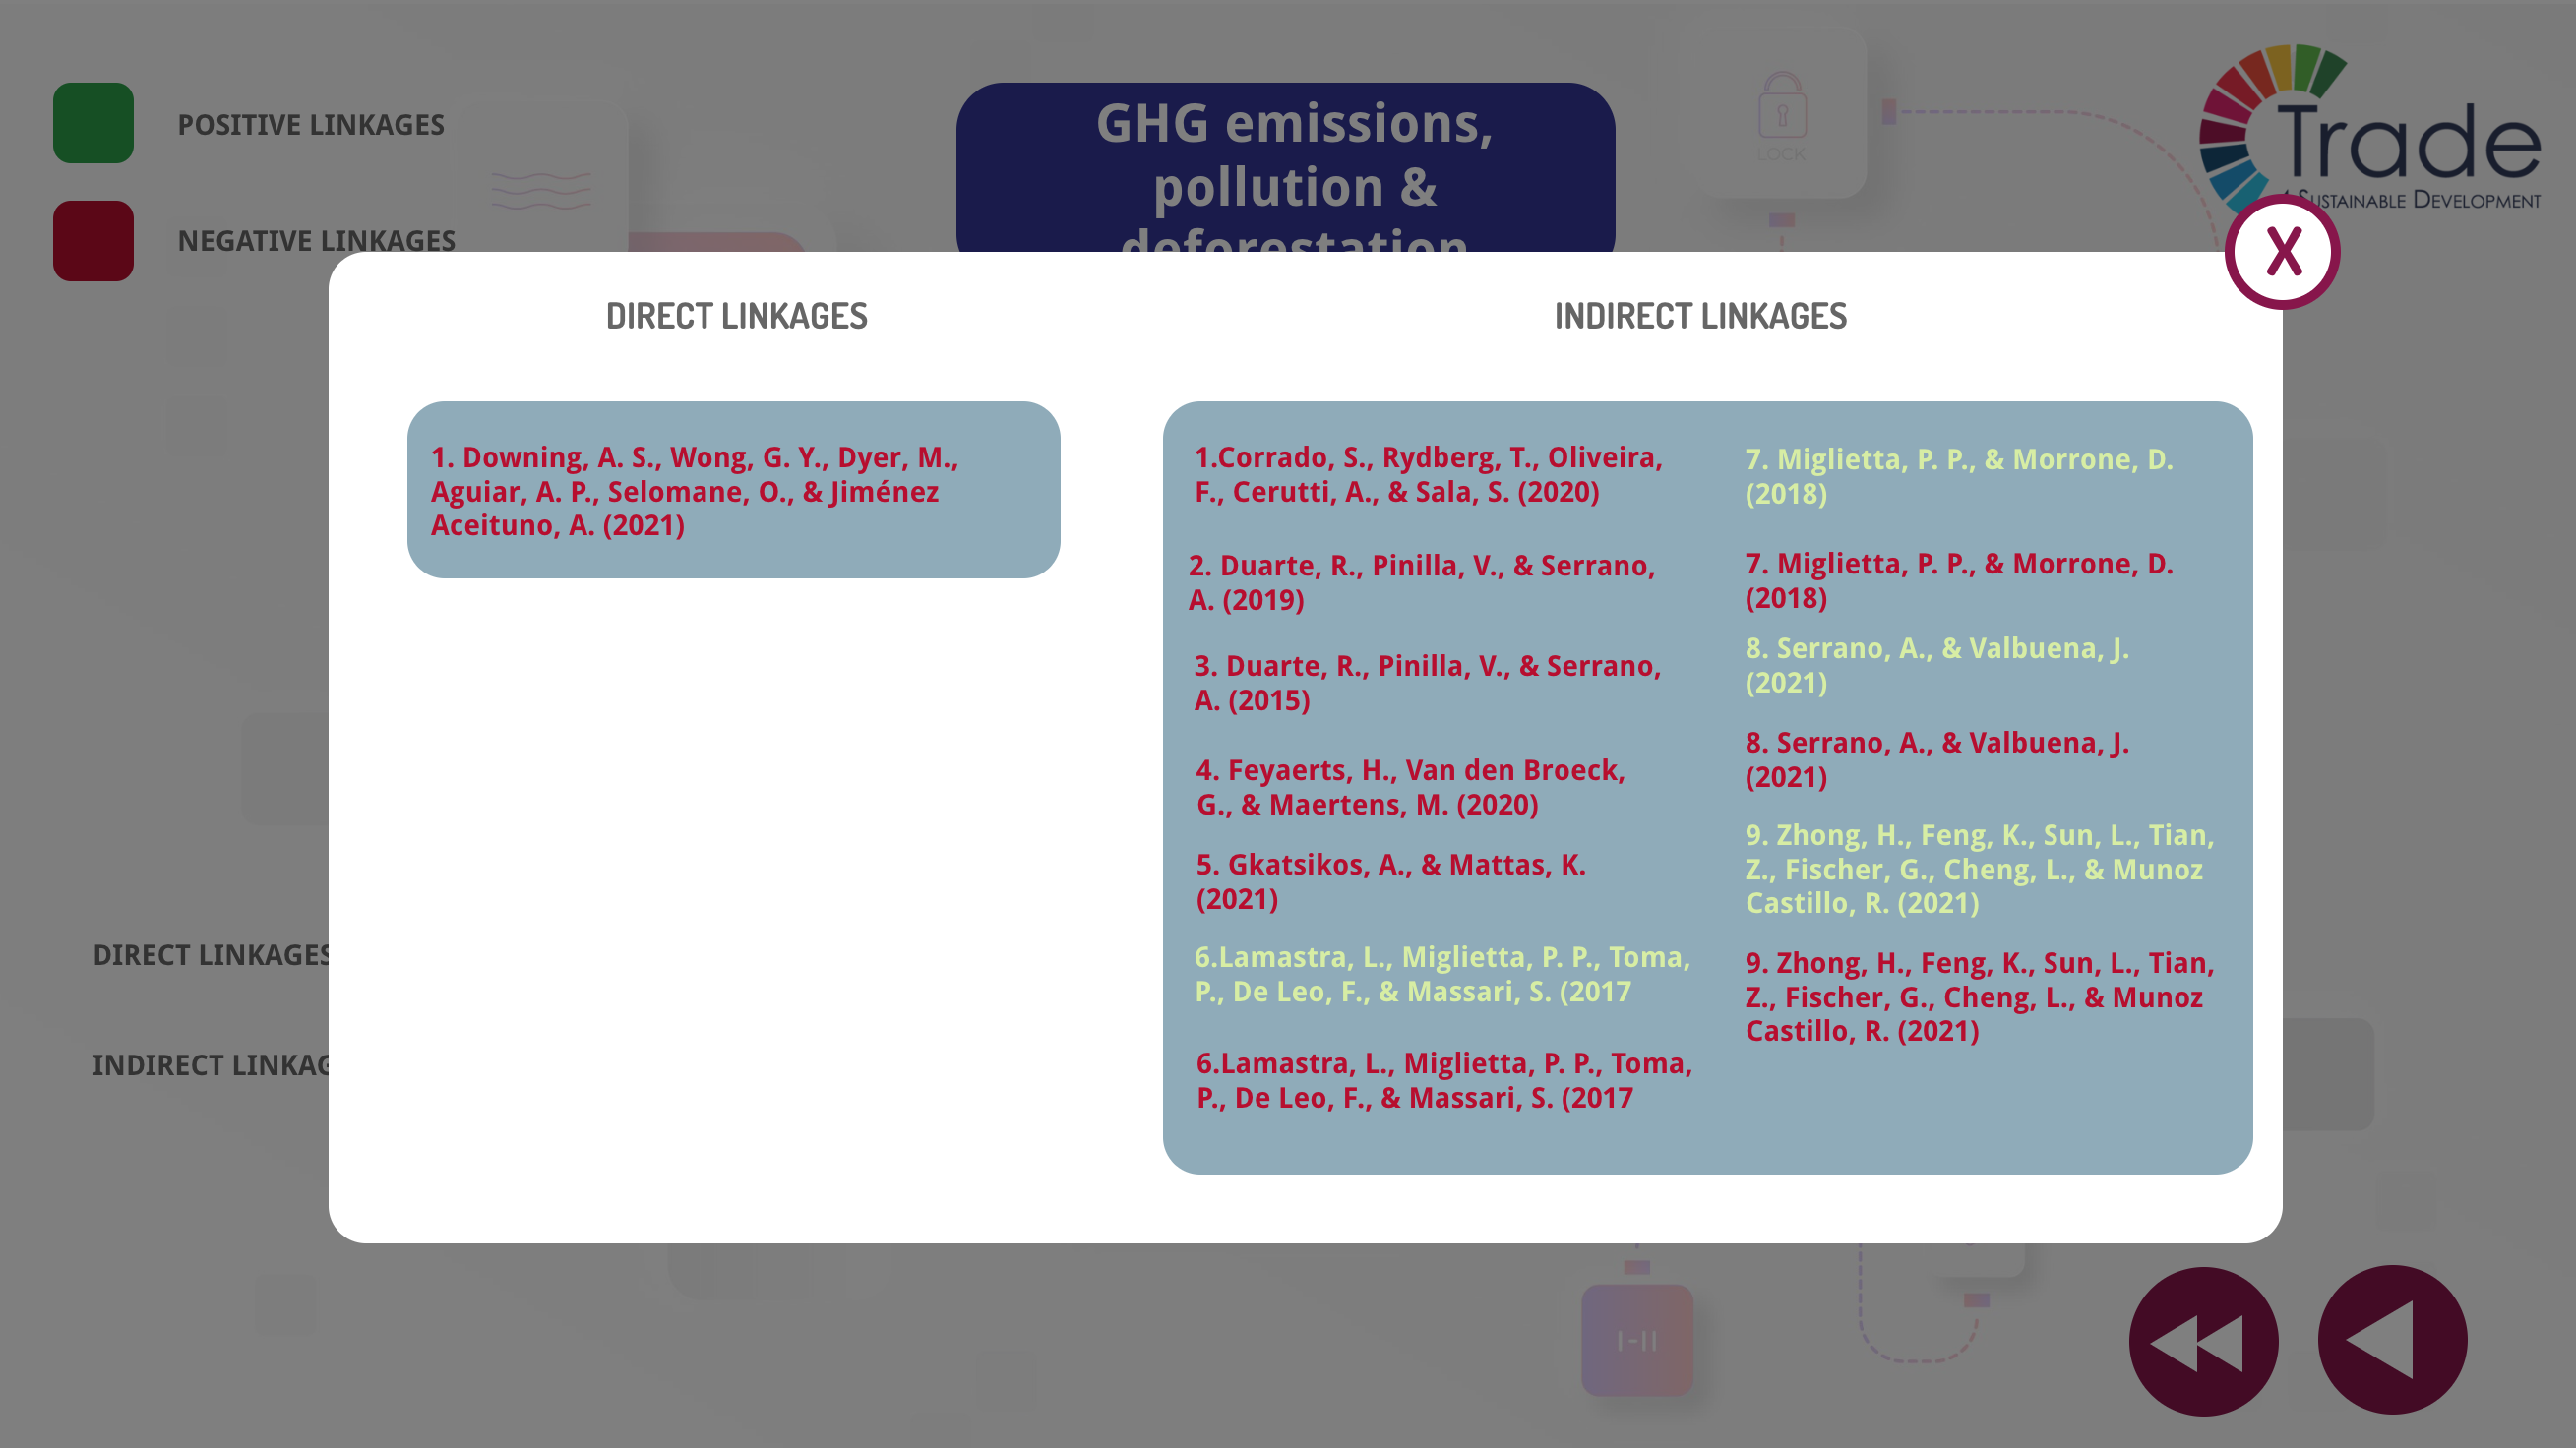
Figure 5: Example of Level 5 the supporting literature, ordered by direct/indirect linkages, and positive/negative impacts
Leave a Reply